Chandra Source Catalog: Onto the Google Sky (Part 2)
As the Chandra Source Catalog was being finalized for release (documents updated, final verifications being performed, etc.) we had some time to try a little experiment:
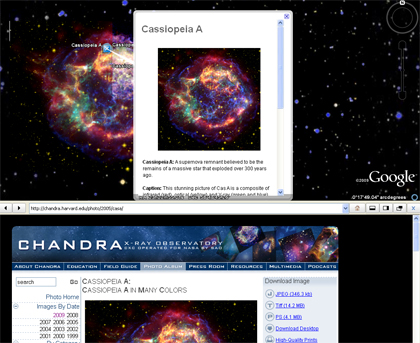
As part of the Catalog, we produce so-called "3-color" JPEG images: red representing low energy, green = medium energy, and blue = high energy. We thought it would be interesting to learn enough of the Keyhole Markup Language (kml) to enable these images to be viewed with Google Earth in its Sky mode.

After grabbing the 10,000 or so JPEG files from the archive and going through Google's KML tutorial; indeed it didn't take longer than a Friday afternoon before we had a few of our observations painted onto the Google Sky. Success!
While the JPEGs in the CSC are not of the same aesthetic caliber as the EPO images, people generally like to visualize data. We quickly forwarded information on how to setup and view the data to some of the other people heavily involved in the CSC project.
There wasn't an immediate response -- everyone else was very busy with the actual catalog release! Over the next few days and weeks we found some spare time to automate the process to include all of the CSC observations and learned how to add things like an outline for each of the instruments, known as a field of view. We tweaked the images to load a little faster; converted them to PNGs so we could add transparency around the edges.
With each minor update we'd send new pointers to the data, but the rest of the team was still very busy with the release. However, when others on the project finally had some time, we gave them a quick little demo of what had been done. The response was overwhelming positive. It was decided that we should get this out to users. ASAP!
Being software folks, we of course have a different definition of "soon". We like to make sure that things are really right before we release. Doing a little more experimenting (which was largely spending modest chunks of time just flying around the sphere); we found some problems. Near the poles the data weren't aligned. We also had a few missing data-sets at the terminator between 360 and 0 degrees of Right Ascension.
We also started to realize more potential. The CSC has JPEG images at multiple spatial resolutions; they should be able to be integrated in as overlapping layers. We also started to think about providing data for each of the nearly 100,000 sources, not just the observations.
What had been a Friday afternoon experiment quickly turned into a full-blown software project and extra staff was pulled in part time to help. Intermittently over the next couple of weeks, we identified the problems near the poles and wrote some new software to warp our data to match the Mercator-style projection that Google uses. We dug into more advanced KML topics that provided the functionality to overlay the multi-resolution images and only load the data needed. We worked to refine and optimize the actual images themselves to bring out fainter sources, to make the data volume smaller, and to tweak the parameters controlling which images get loaded. The Beowulf cluster used in the catalog run was re-awakened to re-process (several times) the data as we made incremental improvements to the images.
While the original project was driven by "what can we do with what we have," we quickly learned that had we considered this interface from the start; we could have provided better data (more scientifically useful) had we made some different choices. So all the while we were plugging away to get this out ASAP, we kept coming up with new and novel ideas that we are planning to incorporate in future releases of the KML data.
The CSC data now available via Google Earth in Sky mode is basically the same science data that a professional astronomer will use. It will be used not only to look for ones favorite source; but can also when preparing proposal (be they for Chandra or another mission) to see where Chandra has already taken data.
Recently we have added the field of view outlines for all approximately 10,000 Chandra observations. Shortly users will see markers for each of the roughly 100,000 sources in the CSC with direct access to the same science data professional astronomers use. The process that creates the multi-resolution images will be upgraded to provide full resolution across the entire image (not just the center of the image). And we hope to provide full mosaics of parts of the sky where we have observed with Chandra multiple times. Users may even start to see Tours of observations referenced in professional journal articles. There are many exciting possibilities.
Enjoy and keep coming back to find out what's new!
-Ken Glotfelty, CXC
Category:
- Log in to post comments
