How to Hold a Dead Star in Your Hand

Illustration: NASA/CXC/K.DiVona
Click here to watch the recent TED talk for this feature!
Objects in space are rather far away. The Moon is our closest celestial neighbor at nearly a quarter million miles from Earth, and the nearest star, our Sun, is 93 million miles away.
These extreme distances mean that it’s usually impossible to touch real objects in space (meteorites that fall to the ground not withstanding). Advances in both astronomy and technology, however, now allow you to do the next best thing: hold a 3-D model of one based on real data.
The story behind such a remarkable feat starts with how astronomers study space. Unlike previous generations of sky gazers, today’s astronomers look at the Universe in many kinds of light, across the full electromagnetic spectrum. Through advanced telescopes and detectors, scientists can “see” from radio waves to gamma rays. Why is this important? We need to look at the Universe in all the types of lights to even begin to understand it.
Take X-rays, for example. Back in 1999, NASA’s Chandra X-ray Observatory was launched in order to observe the high-energy Universe including such things as colliding galaxies, black holes, and supernova remnants.
One such supernova remnant that Chandra studies is Cassiopeia A. About 400 years ago, in our own Milky Way galaxy, a star that was about 15 to 20 times the mass of our Sun, detonated in a supernova explosion.
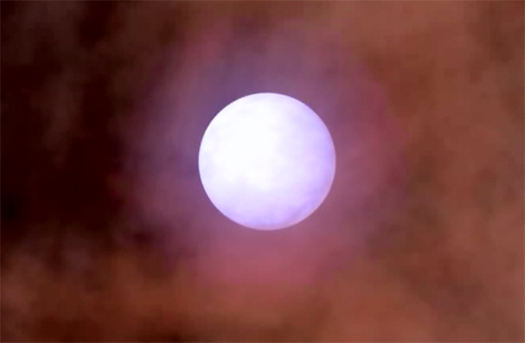
Animation of a supernova explosion. Credit: NASA/CXC/A.Hobart
If we look at Cassiopeia A in optical light, the kind the human eye detects, we see delicate filamentary structure at around 10,000 degrees Celsius.
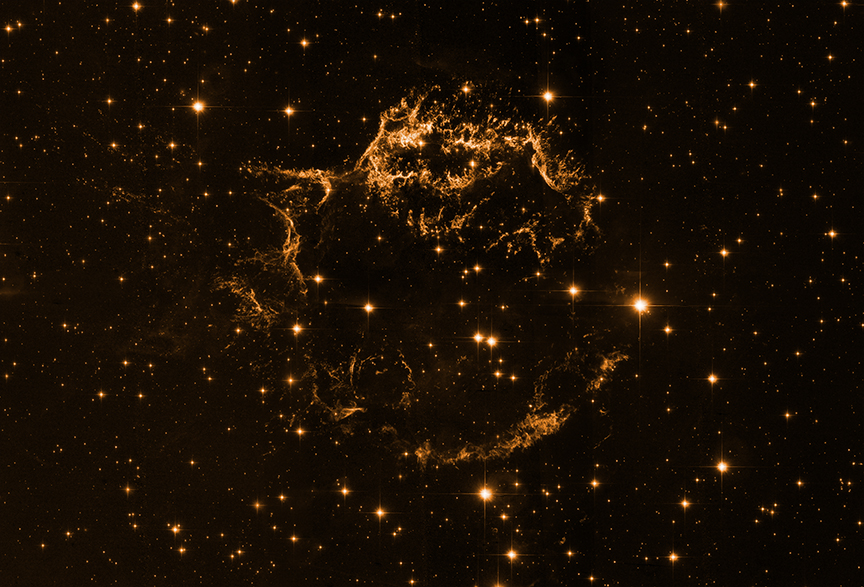
Cassiopeia A in optical light from the Hubble Space Telescope. Credit: NASA/STScI
Death comes alive in the X-ray image of Cassiopeia A from Chandra, however, looking at material that’s millions of degrees hot. There is so much energy that it heats up the debris field to temperatures that cause the material to glow in X-ray light.
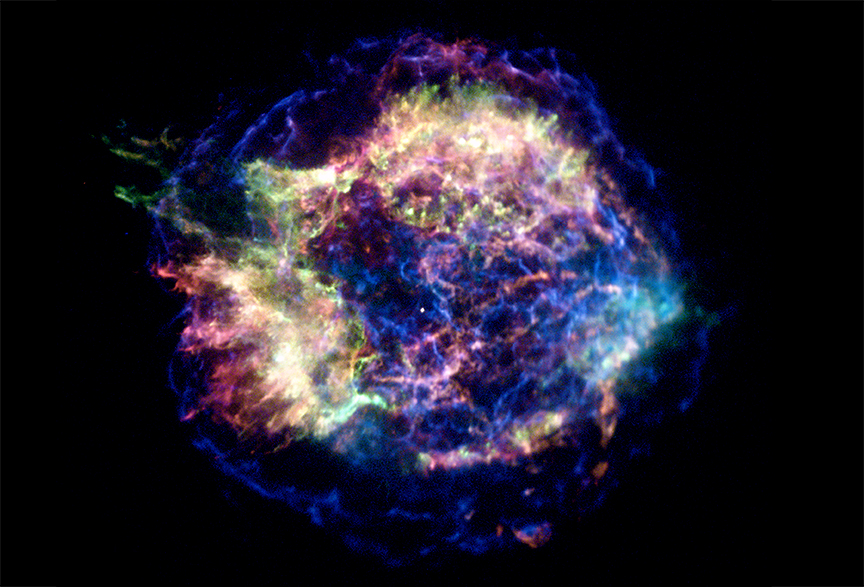
Cassiopeia A in X-ray light from the Chandra X-ray Observatory. Credit: NASA/CXC/SAO
But how do we get to this point? When a satellite such as Chandra observes an object in space, its camera records photons – essentially a packet of energy that makes up electromagnetic radiation, a.k.a. light. The arrivals of these photons are recorded by detectors aboard Chandra and delivered to Earth via NASA’s Deep Space Network, a series of large radio dishes around the globe. The data are coded in the form of 1's and 0's, and scientific software (back on Earth) then translates that data into a table that contains the time, energy and position of each photon that struck the detector during the observation. The data are further processed with software to form the visual representation of the object.
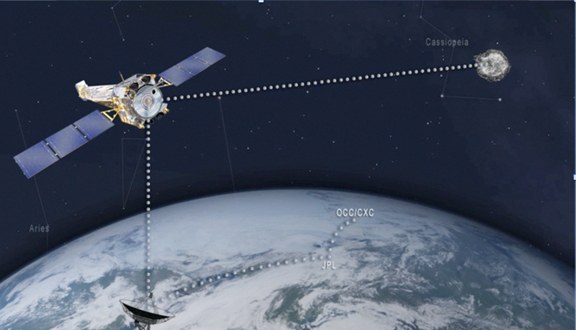
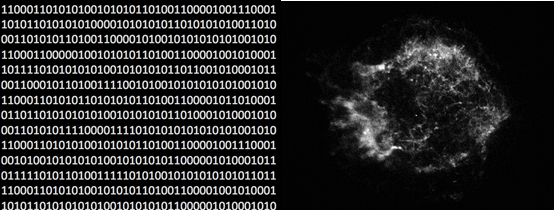
The data path from the cosmic source, to the satellite, to Earth. The data transmitted in binary code before being translated into a visual representation of the object. Credit: NASA/CXC/SAO
Once the data are in the form of an image, different colors can be assigned to various slices of light detected. For example, a common color palette of chromatic ordering is based on the amount of energy and often includes three layers: red is applied to the lowest energy band, green to the medium, and then blue to the highest energy band in the dataset.
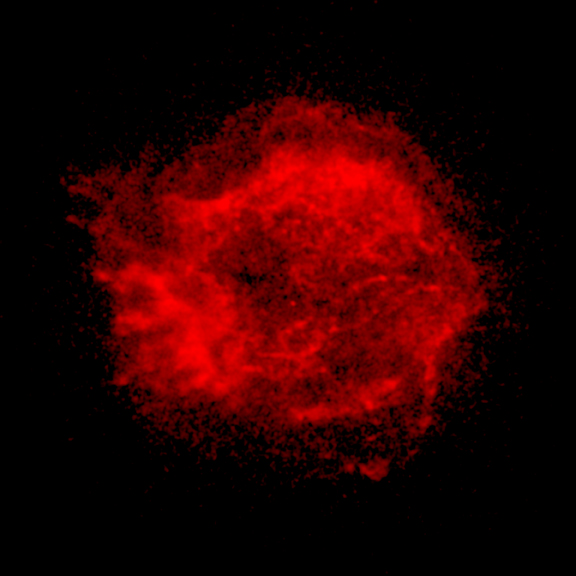
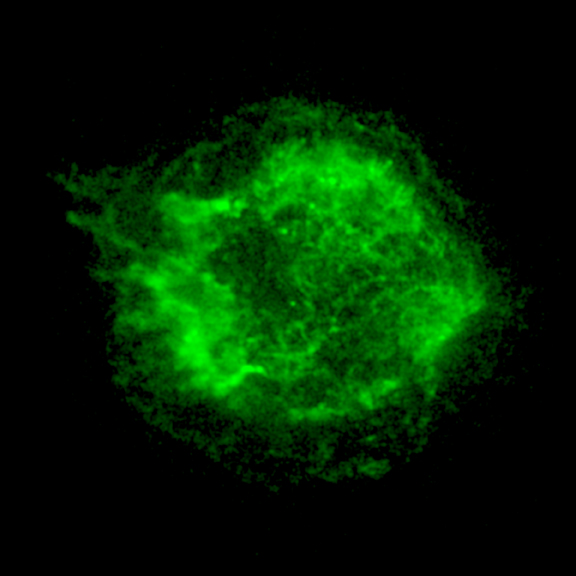
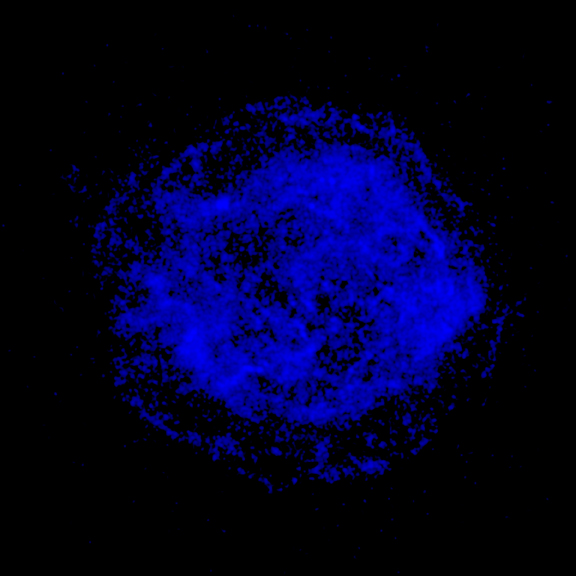
Coloring the Universe in red, green and blue. Credit: NASA/CXC/SAO
When this is done for X-rays detected by Chandra for Cassiopeia A, new and important information is revealed. The blue, wispy arcs in the image show where the acceleration is taking place in an expanding shock wave generated by the explosion. The red and green regions show material from the destroyed star that has been heated to millions of degrees by the explosion.
NASA’s Chandra X-ray Observatory has observed Cassiopeia A many times over the 17 years it has been in operation. The aggregate amount of observing time is over two million seconds, which means there is a great deal of information to work with. Scientists can use this rich dataset to go beyond a static image and see it moving over time.
Time-lapse of Chandra X-ray observations of Cassiopeia A. Credit: NASA/CXC/SAO
This time-lapse movie of Chandra’s X-ray data was made by combining observations taken in 2000, 2002, 2004, and 2007. Scientists can use this to measure the expansion velocity of the leading edge of the explosion's outer blast wave. The researchers find that the velocity is about 11 million miles per hour.
But that’s not all. By combining X-rays from Chandra with infrared data from another orbiting NASA observatory, the Spitzer Space Telescope, plus visible light information from telescopes on the ground, something special can be done. For the first time, a three-dimensional reconstruction of a supernova remnant was created using these data taken in different types of light.
Because Cassiopeia A is the result of an explosion, the stellar debris is expanding radially outwards from the explosion center. Using simple geometry and the Doppler effect, we can create a 3-D model. That data were actually imported into a program originally used for brain imaging, which was then modified for astronomy data by the Astronomical Medicine Project at Harvard.
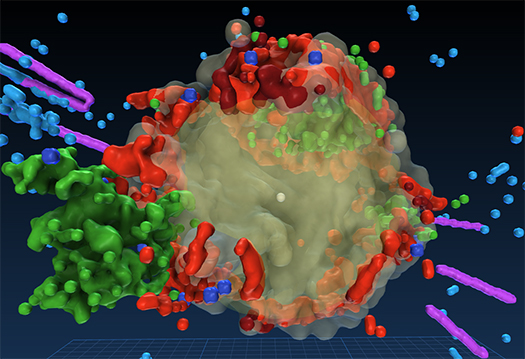
3D model of Cassiopeia A. Credit: NASA/CXC/SAO & Smithsonian Institution.
Commercial animation software was then used to create this stylized 3-D fly-through. It is the first time astronomers can see above, below, around and through an exploded star.
3D animation of Cassiopeia A. Credit: NASA/CXC/SAO/D.Berry
The insight into the structure of Cas A gained from this 3-D visualization is important for astronomers who build models of supernova explosions. Now, they must consider that the outer layers of the star come off spherically, but the inner layers come out more disk-like with high-velocity jets in multiple directions.
While this 3-D model is exciting for astronomers who study exploded stars, the work on Cassiopeia A is not solely for the experts. Collaboration with specialists at the Smithsonian Institution led to the creation of the first ever 3-D print of a supernova remnant based on observational data. This model of Cas A is available free online so you too can make a copy if you have access to a 3D printer at your local library, Maker Space, school, etc.
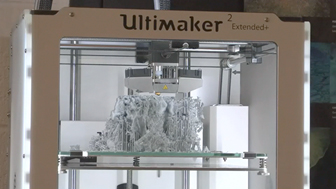
That’s the story of how one cosmic object – or at least a representation of one – came down to Earth. It’s taken hundreds of years, a journey of trillions of miles, and some incredible scientific and technical advances, but now anyone can hold (the remains of) a dead star in their hand.
-Kimberly Arcand
with many thanks to Megan Watzke, Peter Edmonds & the Chandra team.
View the recent TED talk of this piece on YouTube. This blog also appeared on Forbes' "Starts With a Bang", May 17, 2016
Read also: Coding (and Coloring) the Universe
Category:
Subcategory:
- Log in to post comments
