The Scientific Evidence within the Ice Core Record
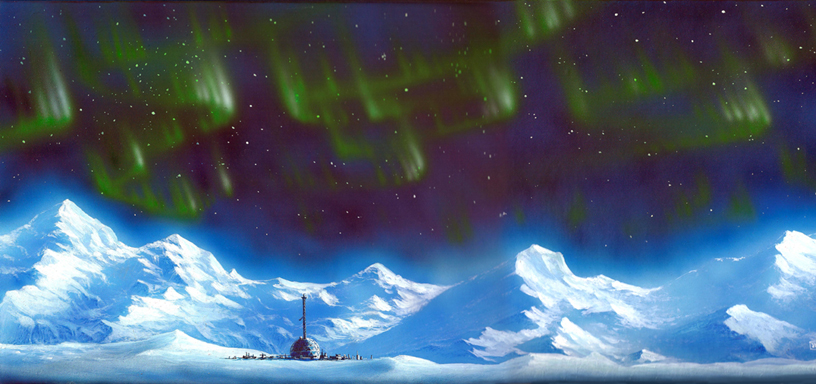
GISP2 Drill Site, Greenland Summit Illustration (Jean-Pierre Normand, Artist)
On July 1, 1993, after five years of drilling, the Greenland Ice Sheet Project Two (GISP2) penetrated through the summit of the Greenland ice sheet and 1.55 meters into bedrock – recovering an ice core 3053.44 meters in depth. The project was supported by the United States, Switzerland, and Denmark. The ice core produced a useable record extending ~100,000 years into the past. The Greenland ice sheet formed from the incremental build up of annual layers of snow; so the age of the ice increases with the depth of the core. The time resolution – the shortest time period which can be accurately distinguished – depends on the amount of annual snowfall, and reduces with depth as the ice compacts under the weight of the layers accumulating on top.

GISP2 Firn (left) & Upper Annual Layers (Right)
The upper unconsolidated layers of snow are called firn. Beneath the firn the upper layers of ice in the core correspond to a single year or sometimes a single season. Deeper into the ice the layers become more compressed and annual layers become indistinguishable. Any materials that were in the snow, such as dust, ash, bubbles of atmospheric gas and radioactive substances, remain in the ice. This abundance of information is used to determine temperature, precipitation, chemistry and gas composition of the lower atmosphere, volcanic eruptions, and solar variability. Ice cores are used to reconstruct an uninterrupted and detailed record extending into the past for thousands of years. Ice cores from the ice sheets of the interior Polar Regions are studied as long-term repositories of physical and chemical records of atmospheric conditions that existed at the time of deposition.
The Greenland GISP2 H-Core Research Project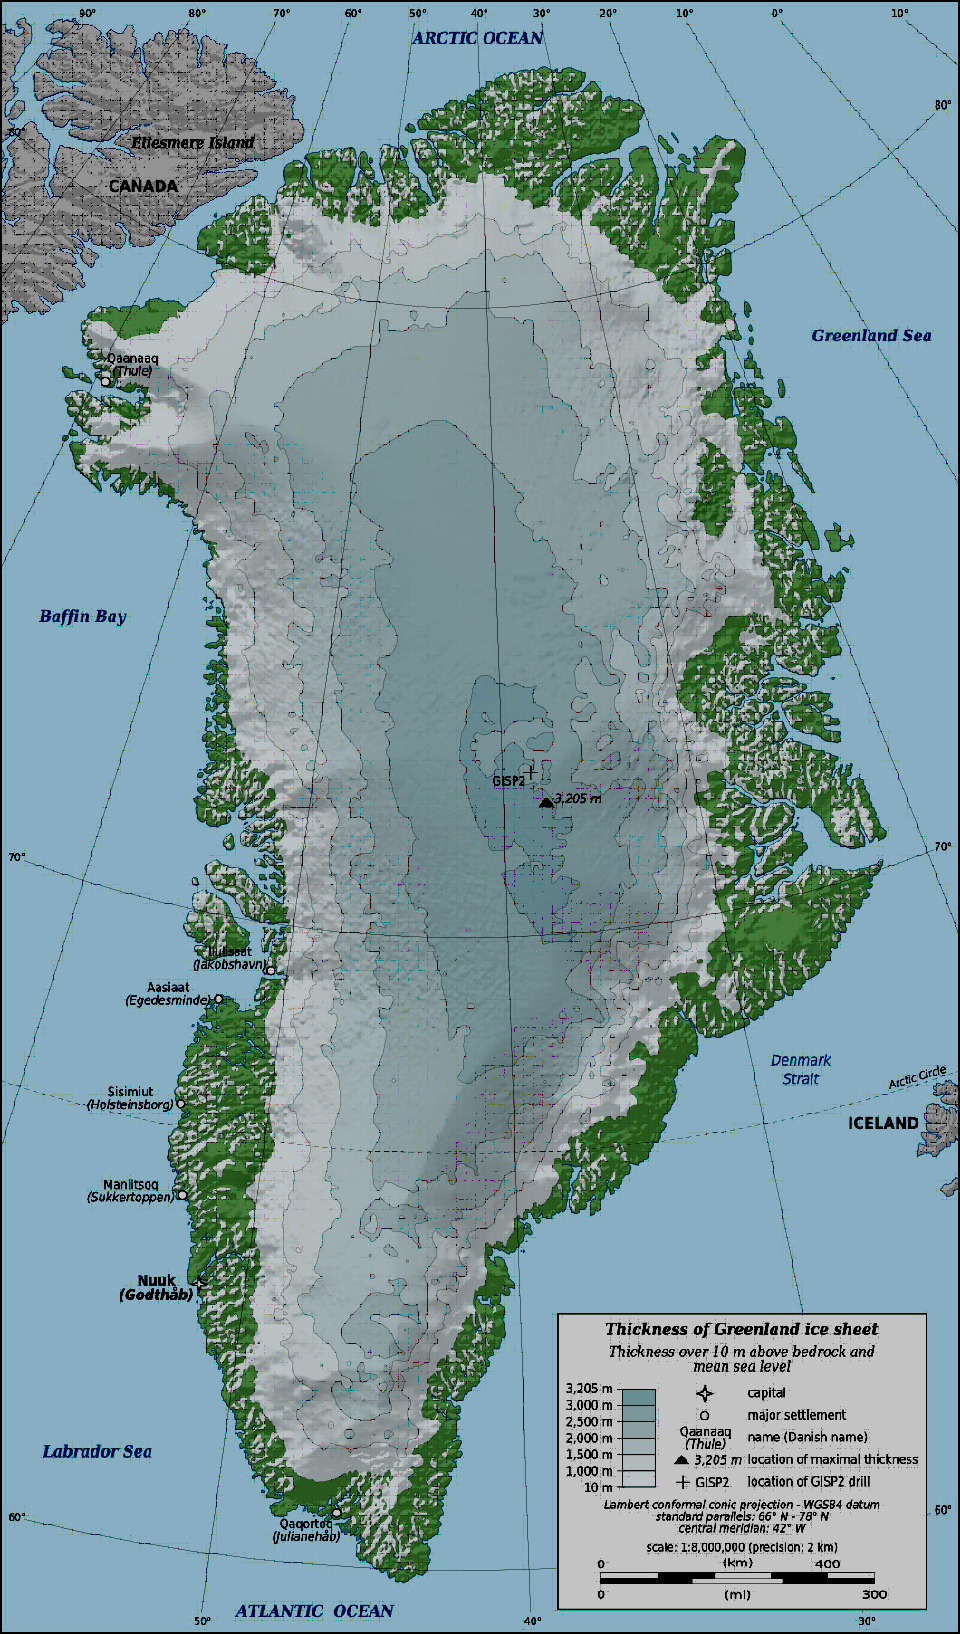
Greenland
Within the framework of the GISP2 core drilling project, an ice core – known as the GISP2 H-Core – was collected in June, 1992 adjacent to the GISP2 summit drill site. The project scientists, Gisela A.M. Dreschhoff and Edward J. Zeller, were interested in dating solar proton events with volcanic eruptions. The GISP2-H 122-meter firn and ice core is a record of 415 years of liquid electrical conductivity (LEC) and nitrate concentrations – spanning the years 1992 at the surface through 1577 at the bottom of the core. The data set consists of a total of 7,776 individual analyses. The upper 12 meters of firn were analyzed on-site in Greenland and the remaining core was sent to the National Ice Core Laboratory in Denver, Colorado. At a later time 3.6 meters of core were added, taking the time series back to the year 1561 – with a total of 8,002 samples analyzed.
At the lab, the core was sliced into 1.5 cm thick samples, and each sample was inserted into a glass vial which was sealed and stored at -24oC. The vials were removed from storage ~20 at a time and allowed to melt at room temperature for one hour. The liquid samples were removed from the vials with a syringe and injected into a UV absorption cell (UV spectrophotometer) to determine the nitrate values in absorption units. After the nitrate values were obtained from the UV spectrophotometer, the samples were inserted directly into a micro-conductivity cell to measure the conductivity in micro Siemens per centimeter (μS/cm). This ultrahigh resolution sampling technique resulted in a time resolution of one week near the surface and one month at depth.

Section of the GISP2-H Ice Core showing the first 1100 samples
The liquid electrical conductivity measurements (LEC) measure the change in acidity along the length of the core. The main feature in the nitrate concentration record is the prominent yearly cycle – with the spring/summer values higher than the fall/winter values. Numerous anomalies also occur in both the nitrate and liquid electrical conductivity (LEC) records. The LEC sequence contains signals from a number of known volcanic eruptions and provides a dating system at specific locations along the core. An especially distinctive signal in both records marks the eruptions of volcanoes in Iceland.
The Liquid Electrical Conductivity (LEC) Record and Volcanoes
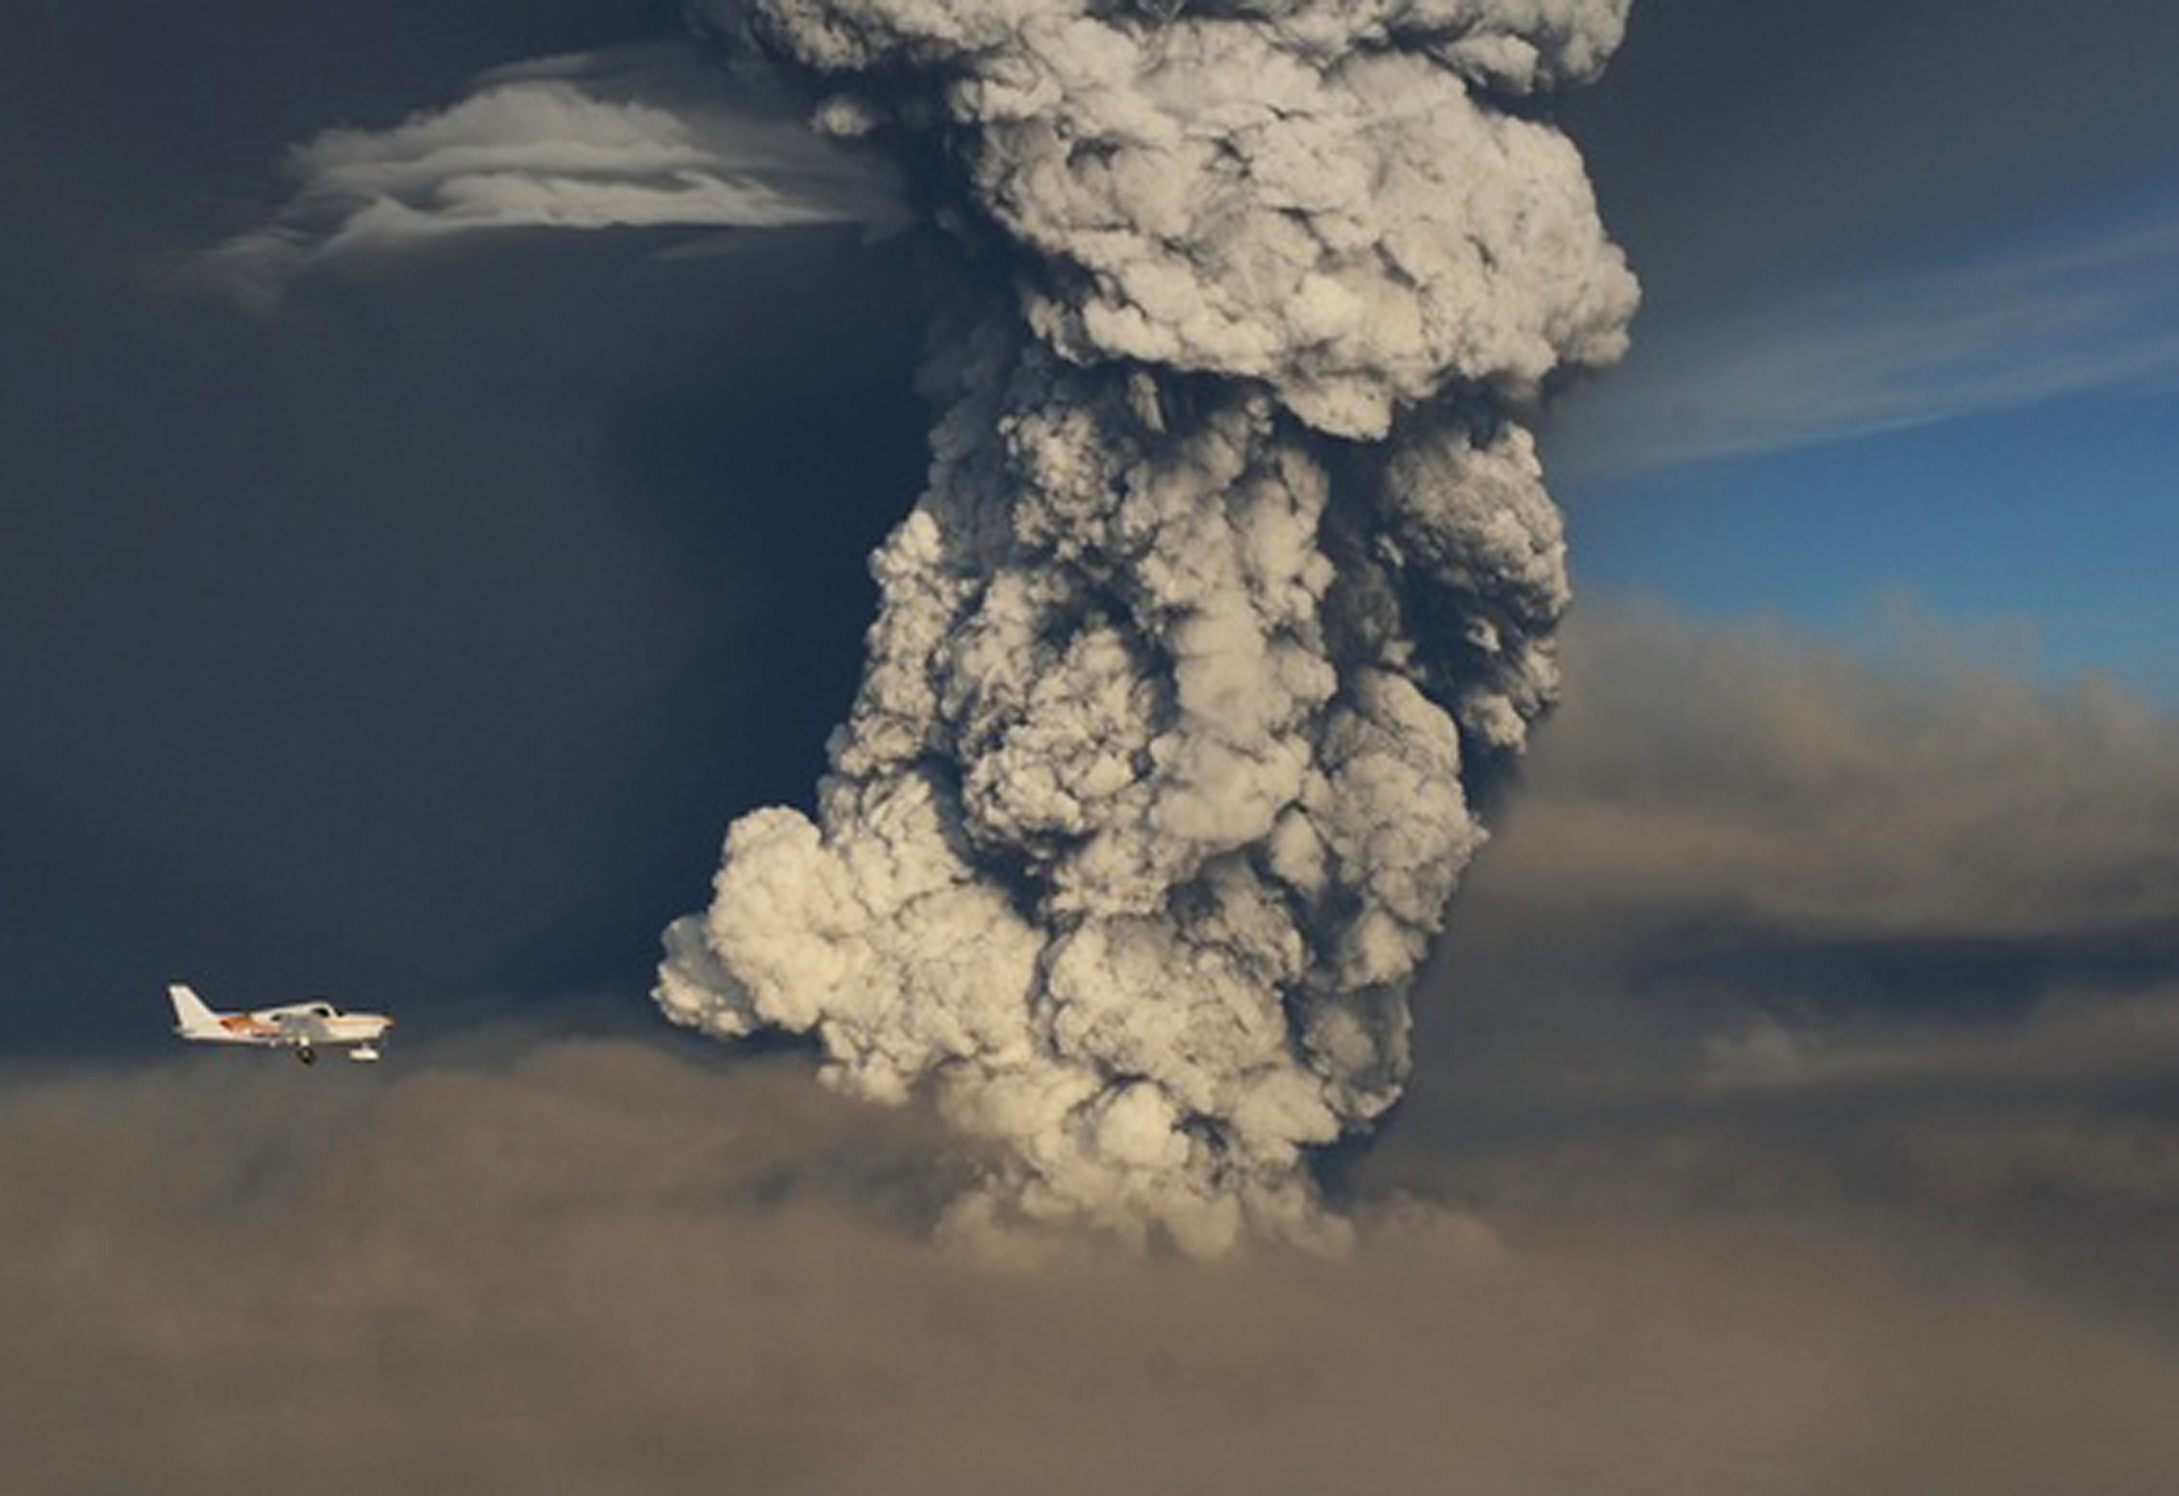
Grimsvotn volcano eruption, Iceland, 2011
Electrical conductivity measurements – indicators of the acidity of the ice – show an annual cycle due to the higher acidity in summer snow relative to winter snow. Scientists think this is due to chemical reactions in the atmosphere involving dimethyl sulphide which is produced in greater quantities during the summer months by marine algae and phytoplankton. The resulting production of low concentrations of sulphuric acid gets deposited over the ice sheet.
Sulfates are often blasted into the atmosphere by volcanic eruptions. Therefore, a conductivity profile of ice cores provides a measurement of annual terrestrial layers and major volcanic eruptions. The profile can even differentiate from nearby Icelandic volcanic eruptions which release most of their products into the upper troposphere, and middle to lower latitude volcanoes which send ejections not only into the upper troposphere were they settle back to the surface fairly rapidly, but also into the stratosphere and are then transported by planetary winds and deposited on the Greenland ice sheet.
Eruptions that occur geographically close to the drill site, such as those from Iceland, produce large and distinctive conductivity signals accompanied by very sharp reductions in nitrate concentrations. The hydroxyl ions (OH-) are preferentially used in the oxidation of volcanic SO2 and therefore are unavailable for the production of nitrates. A conductivity spike accompanied by an opposing nitrate drop is the unique signature of an Icelandic volcano.
The Nitrate Record and Solar Proton EventsCharged particles from solar activity follow the Earth’s magnetic field lines and enter the atmosphere above the Polar Regions. The particles ionize nitrogen and oxygen within the polar stratosphere, generating oxides of nitrogen with nitrates (NO3-) as the end product. Changes in solar activity lead to changes in the amount of nitrates in the atmosphere; and therefore in the amount of nitrates that get deposited in the Polar Regions. Solar activity and the resulting solar proton events leave a continuous record of nitrate deposits within the polar ice; therefore, a measurement of the nitrate record is a reflection of solar activity. Prolonged and sustained solar observations are fairly recent – since the early 1600’s – and ice core data provides evidence of solar behavior that pre-dates telescopes and satellites.

The Sunspot and Auroral Record, 1600 – 2000

Jean-Pierre Normand, Artist
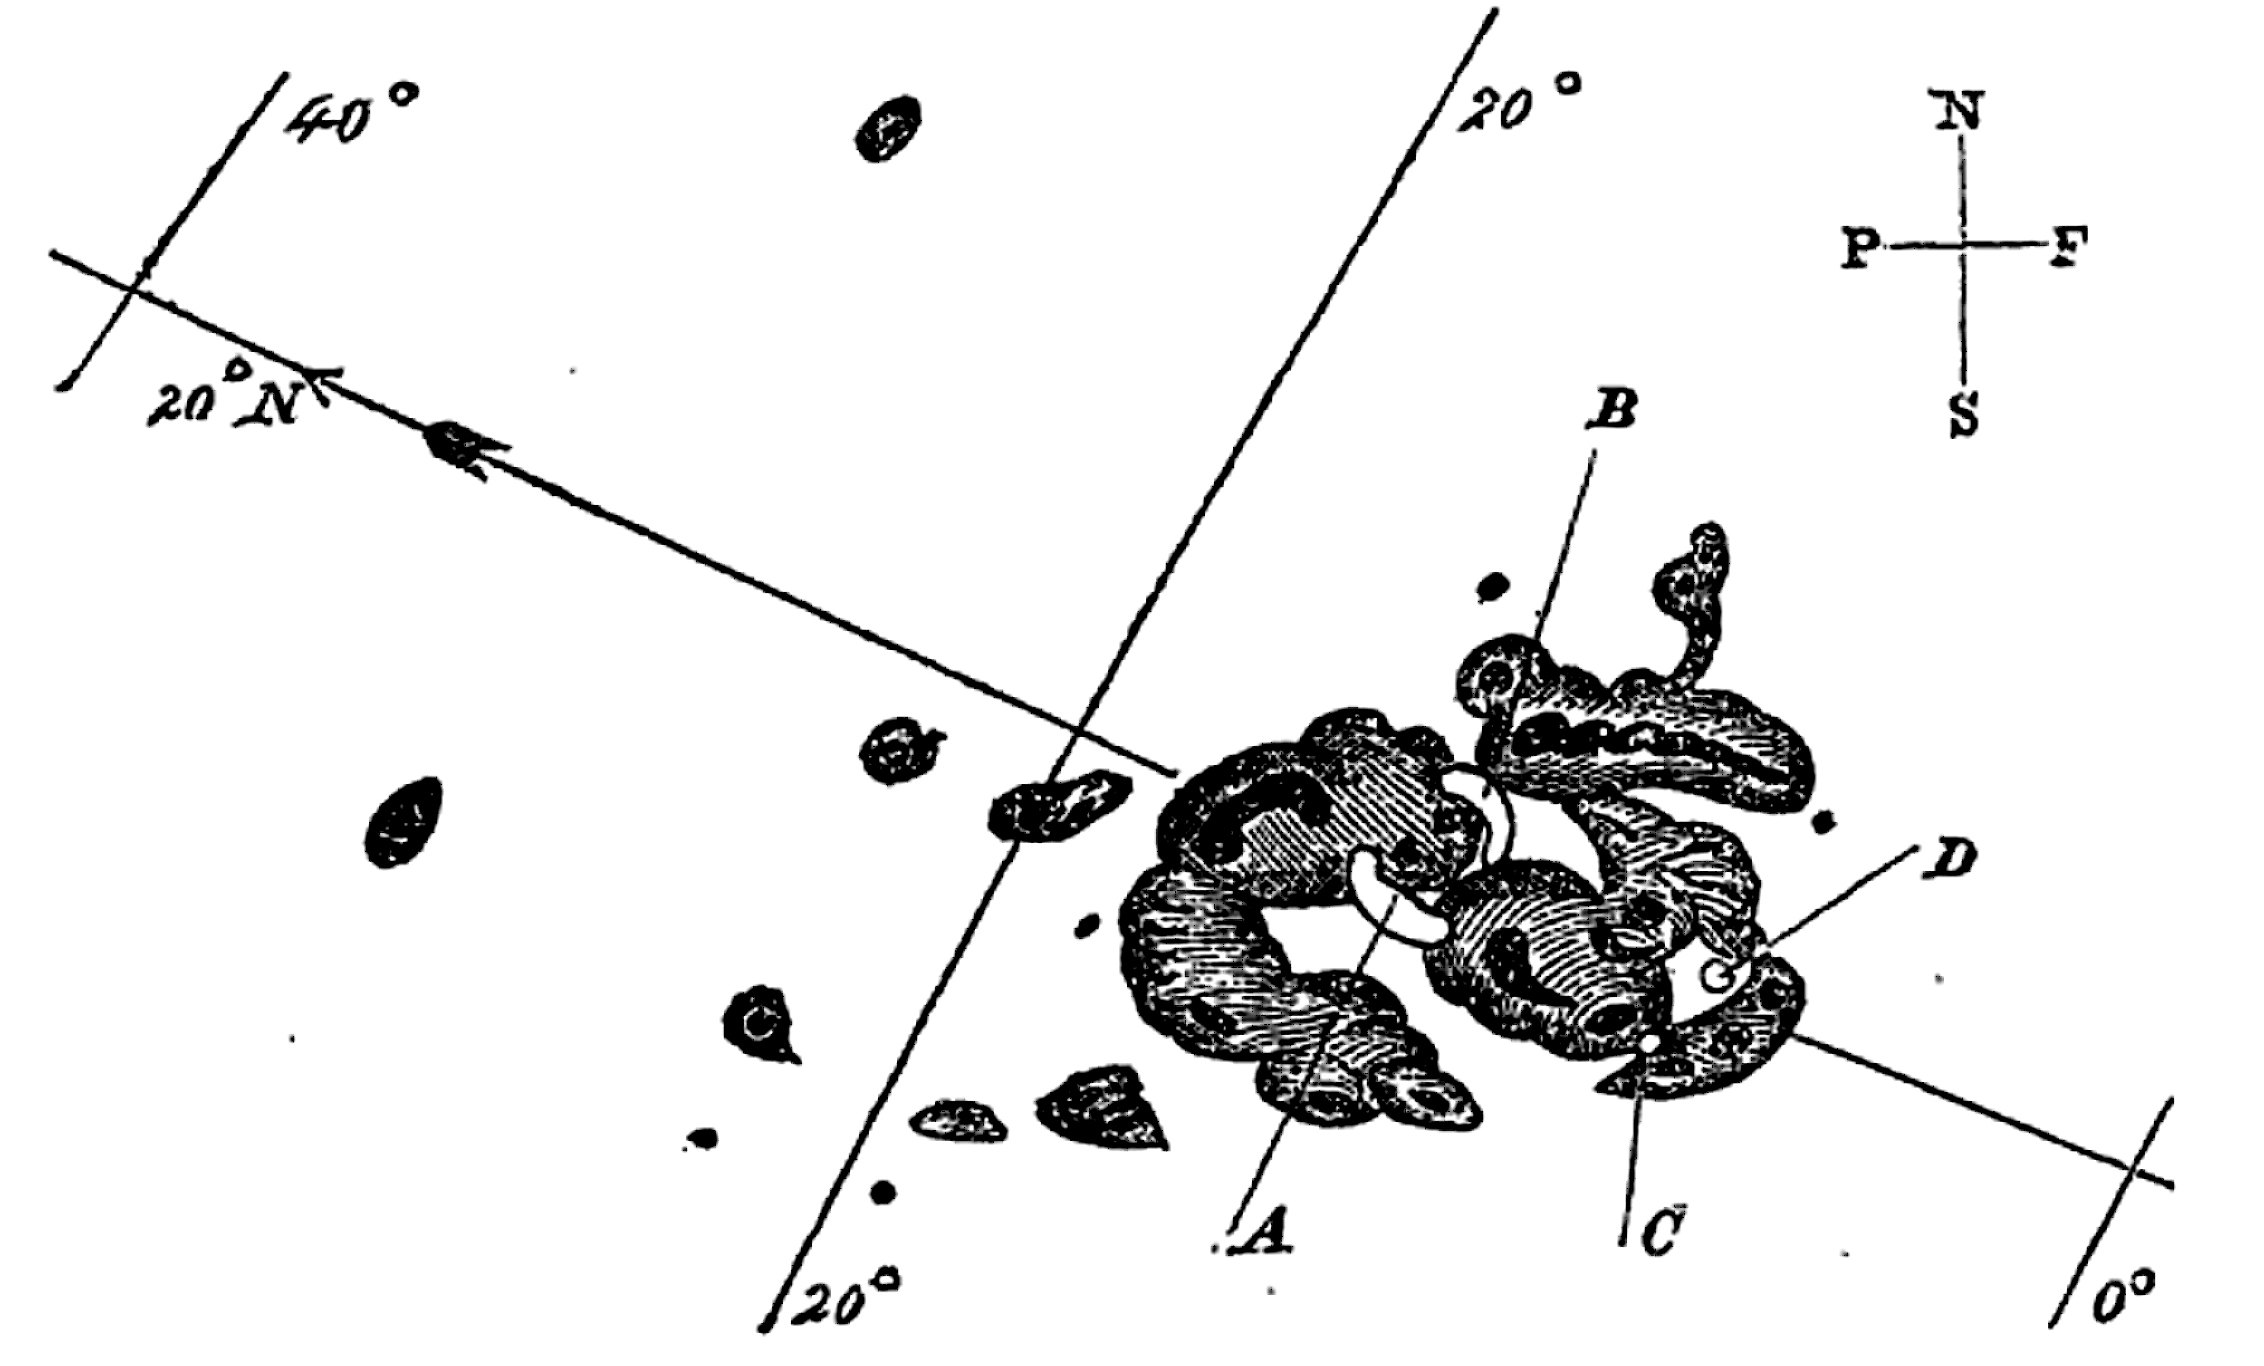
The background one-year seasonal nitrate record produced by marine organisms and other terrestrial tropospheric sources is overlaid by individual events resulting from solar charged particles several standard deviations above the background. Dating of the ice core is achieved by counting the nitrate annual cycles, aided by time-control points from a simultaneous record of volcanic eruptions where sulfates were injected into the atmosphere and deposited onto the ice sheets. The majority of impulsive nitrate enhancements are expected to occur during periods of increased solar activity; however, in rare cases they also appear during periods of minimal solar activity – then they become of particular interest in identifying nitrate sources for events other than solar activity. Two long periods of solar activity minima, the Dalton (1833 – 1798) and Maunder (1715-1645) Minima, occur in the GISP2 H-core record. A major nitrate anomaly in 1859 is related to a solar flare that was optically observed by Richard Carrington in England – the first observation of a solar eruption which resulted 17 hours later in a major geomagnetic storm on Earth. If there are any unique nitrate anomalies during periods of unusually low solar activity, nitrate peaks several standard deviations above the mean, and they are not produced by any known solar or terrestrial sources – then what does?
Such individual and distinctive nitrate ion (NO3-) enhancements provide the possibility of identifying such nitrate events in association with supernovas (SNe) as the source of atmospheric ionization with deposition in the very thin layers of ice in the Polar Regions.
The Historical Tycho and Kepler Supernova (SNR) Events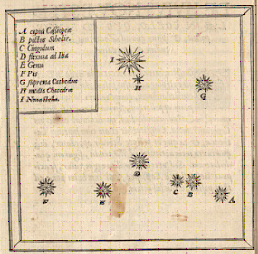
Tycho's Stella Nova
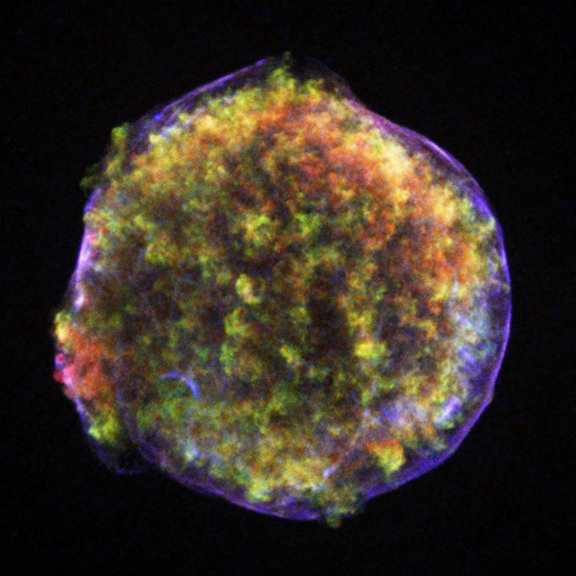
Tycho Brahe discovered a "new star" in 1572 that he referred to as Stella Nova. Tycho's observations of Stella Nova are considered to be the beginning of the separation of astronomy as a scientific discipline from its astrological beginnings. Known as Tycho’s supernova, the event was the result of the thermonuclear destruction of a white dwarf stellar core – a Type Ia supernova event. The supernova remnant (SNR) is 7,500 light years from Earth in the direction of the constellation Cassiopeia.
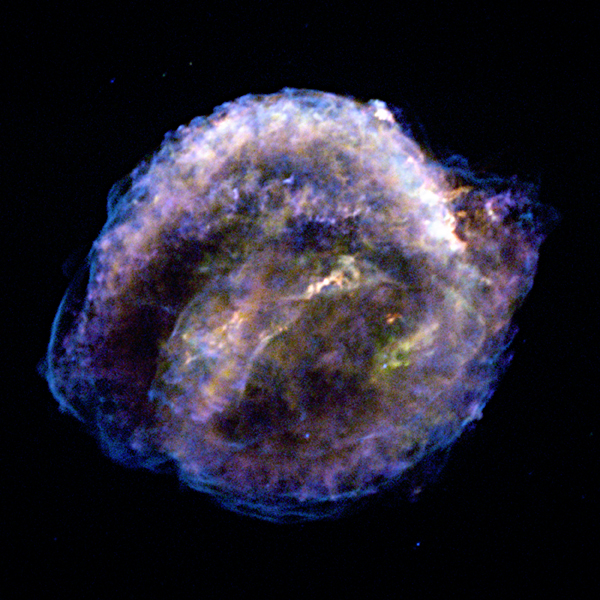
Johannes Kepler, a contemporary of Brahe, observed and studied a Type Ia supernova event in October of 1604 – 32 years later. Kepler’s supernova resides in the constellation Ophiuchus and is 13,000 light years away. After observing the star for two years, he published “De Stella Nova in pede Serpentarii”, describing its properties. Both of these supernovas were observed and studied before the telescope was invented – this was possible because Type Ia events are thermonuclear explosions and produce enormous amounts of energy. Both Tycho Brahe and Johannes Kepler observed and recorded their individual Supernovas (SNe) – providing an accurate date for the appearance of the events and creating an opportunity to correlate supernovas (SNe) with nitrate anomalies within ice cores.
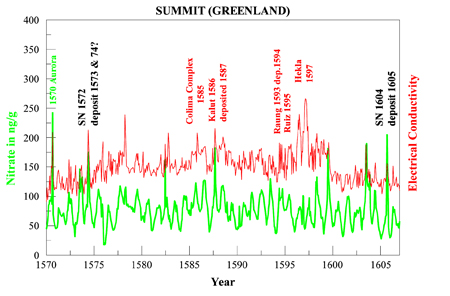
Gisp2 H-Core Greenland Summit Ice Core Data
In the GSIP2-H ice core segment shown to the left, there are major nitrate and conductivity anomalies at the times of the Tycho and Kepler supernovas. There are no known events that could have produced nitrate spikes of this magnitude, and they occur about one year after Tycho and Kepler observed and recorded these two events. As discussed above with the geographical distribution of volcanic eruptions used to provide the time markers, high energy photons from SNe (X-rays and gamma rays) that enter the stratosphere and ionize atmospheric nitrogen, may have up to a one year time delay before the excess nitrates that were produced are deposited in the Polar Regions.
Supporting Supernova Evidence From Antarctica Ice Cores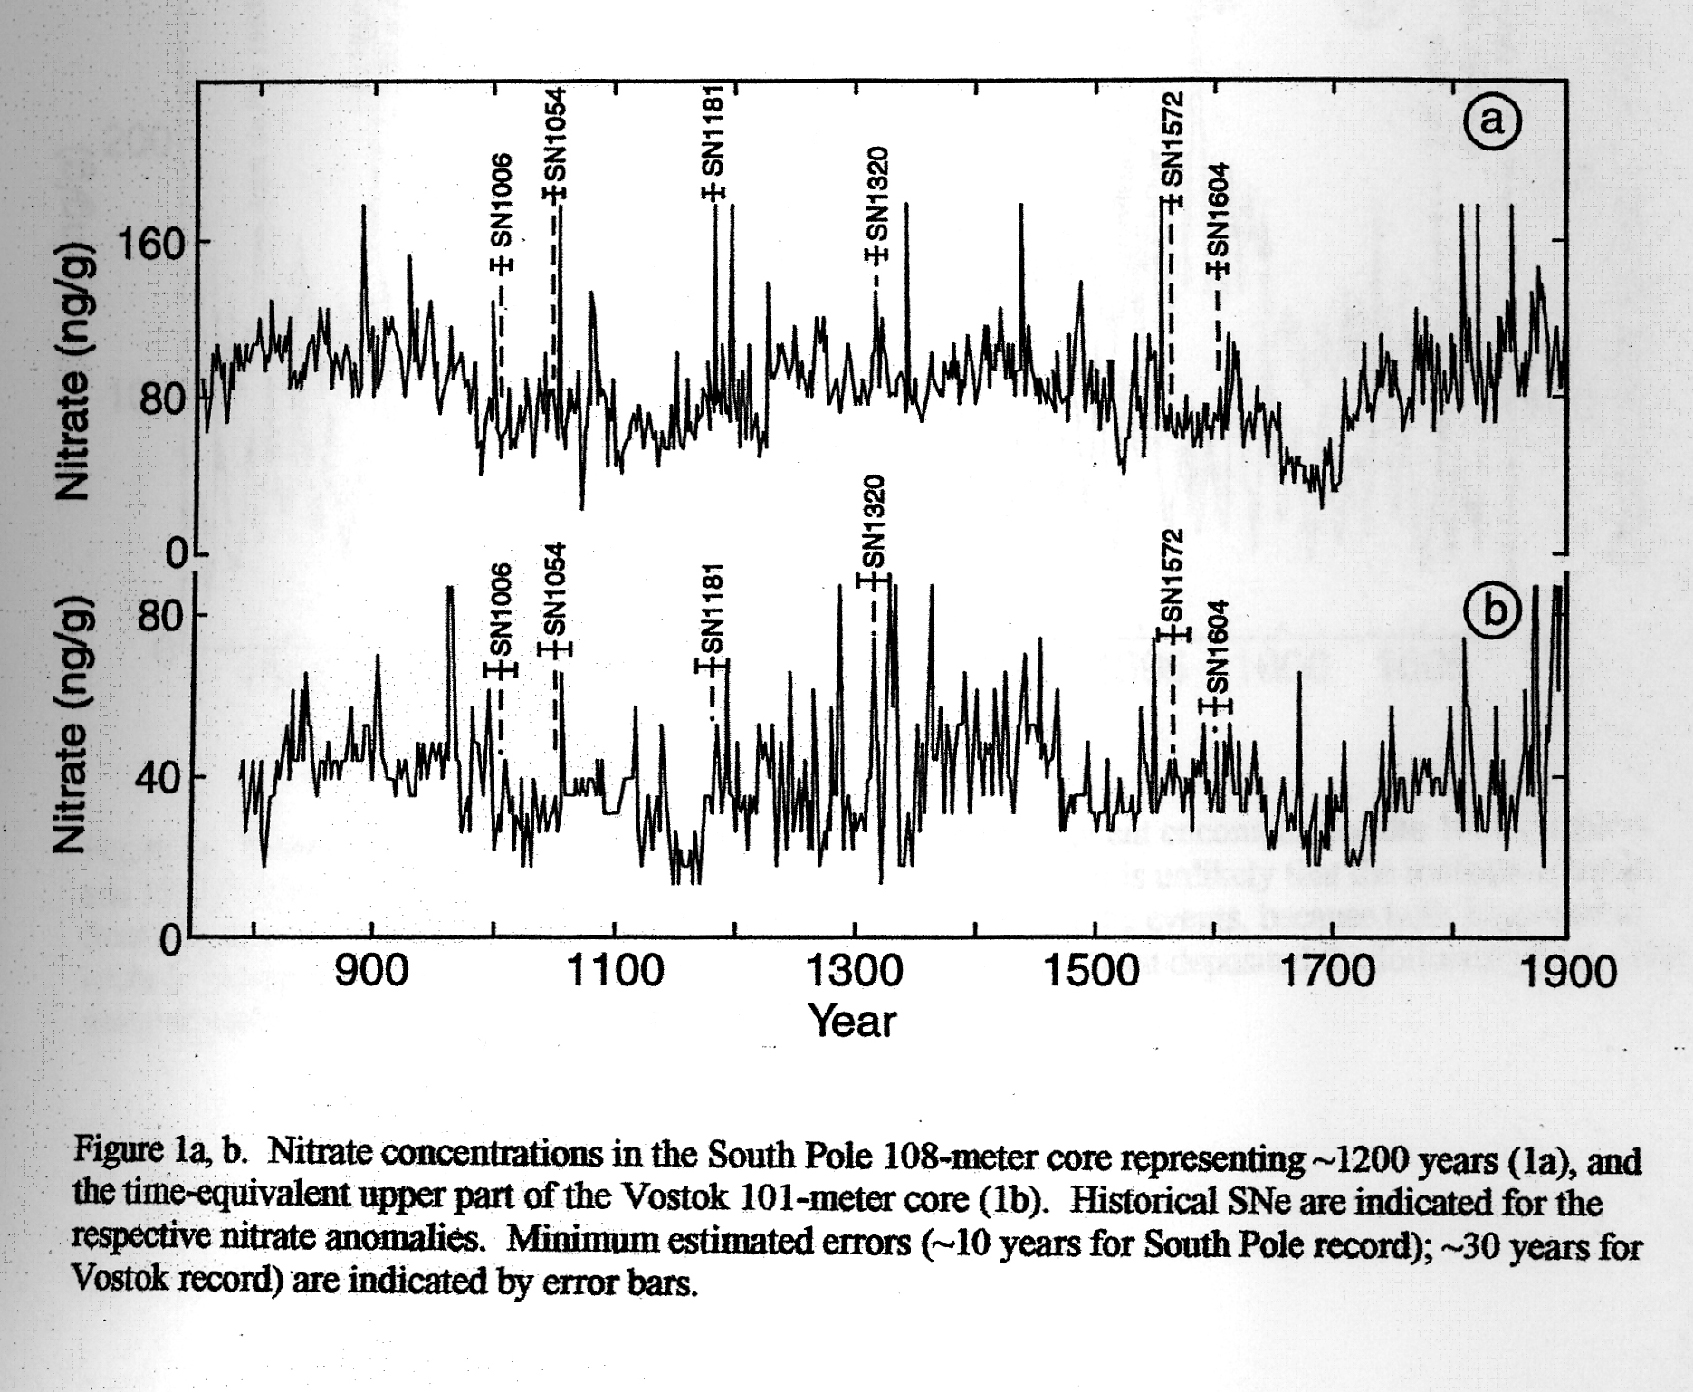
Ice Core data from Antarctica [South Pole (a) and Vostok (b)]
Gisela A.M. Dreschhoff and Edward J. Zeller spent several seasons in Antarctica before the GISP2-H core project. During an earlier ice core expedition to Antarctica, Dreschhoff and Zeller had discovered evidence for a more than a 1000 year stratigraphic record of supernovas in polar ice at two sites – the South Pole and Vostok. The South Pole data show a series of anomalous concentration spikes which appear to correlate with the historical supernovas SN 1006, SN 1054, SN 1181, SN 1572, and SN 1604. When the South Pole data were compared with the equivalent time period of the Vostok core, similar spikes were found to occur in time equivalent locations – within the dating error bars as indicated in the figure to the left. High energy photons from supernova events can penetrate the Earth’s atmosphere to an altitude of 27-32 km before Compton scattering begins to convert their energy to that of ionizing electrons, which then contribute to the production of nitrates. The supporting evidence from Antarctica, along with the high resolution data set from Greenland, provides detailed information about the ionization history of the polar stratosphere, induced by energetic solar protons and/or X-rays and gamma rays from supernova events. Of particular interest in these studies is the detection of the closely occurring supernova pair of Tycho (1572) and Kepler (1604) with the correct time separation.
Jean-Pierre Normand, Artist
The ice cores from Vostok and the South Pole cover a longer length of time and include evidence of earlier historic supernovas. The difference with these cores is that, due to the lower snow accumulation at those sites, the resolution was one year at the South Pole and two years at Vostok as compared to the ultra-high resolution (one week to one month) analysis that was part of the GISP2-H ice core. However, several possible supernova-nitrate anomalies are contained with the cores.
Dating Historic and Pre-historic Supernova Events with Ice Cores
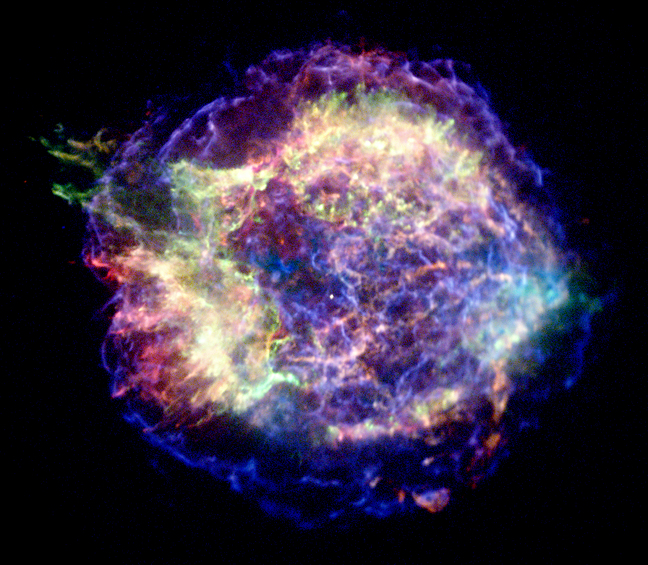
Was the catastrophic collapse that resulted in the Cassiopeia A (Cas A) supernova remnant recorded in the Polar Regions? There is a single nitrate anomaly in the Greenland record in 1667, during the Maunder Minimum. This is well-dated because it is preceded by one month by the volcanic signal of Tarumi in 1667. Is the 1667 nitrate spike which occurs in the GISP2-H core from Greenland as well as the two ice cores – Vostok and the South Pole – in Antarctica the signature of the Cas A event? Unlike the Tycho and Kepler SNe, there were no observational records for Cas A – and it seems to have gone undetected except for an ambiguous entry in the journal of the Royal Astronomer of Greenwich John Flamsteed in 1680 and fragments of literature that refers to a star that appeared in the sky on the birthday of King Charles II of England in 1630. The two anomalies that are dated during the correct time location and separation that could be the Tycho and Kepler event are certainly intriguing – even compelling.
Back to Ice Core Index


