
CXC Home | Search | Help | Image Use Policy | Latest Images | Privacy | Accessibility | Glossary | Q&A
Q:
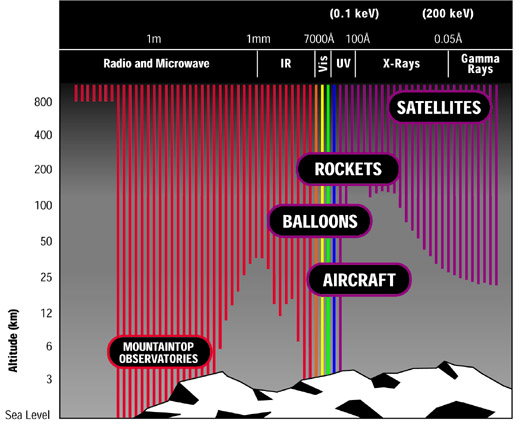
Do you have a data table from which the electromagnetic spectrum illustration ( http://chandra.harvard.edu/graphics/resources/illustrations/absorption_72.jpg ) was made?
A:
This figure was adapted from a NASA publication.
The data for the IR could probably use some modification, to take into account the difference between Mauna Kea and Kitt Peak. For this region of the spectrum, you might want to look at
http://www.gemini.edu
http://www.tuc.nrao.edu/~sradford/j4/
A. Cox, Allen's Astrophysical Quantities, (4th Edition, Athlone Press, London, 2000) p. 123, and 145
Other useful graphs can be found in
http://ads.harvard.edu/cgi-bin/bbrowse?book=hsaa&page=239
http://ads.harvard.edu/cgi-bin/bbrowse?book=hsaa&page=240
A lot more info can be found by doing a Google search on "Atmospheric Transmission."
Revised: September 01, 2017