
CXC Home | Search | Help | Image Use Policy | Latest Images | Privacy | Accessibility | Glossary | Q&A
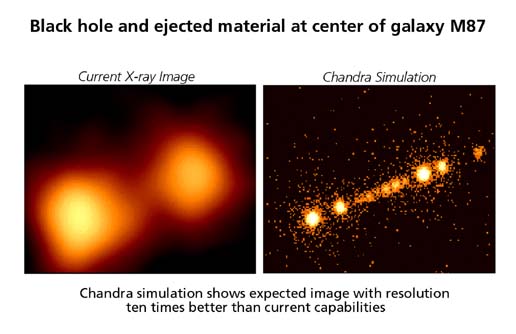
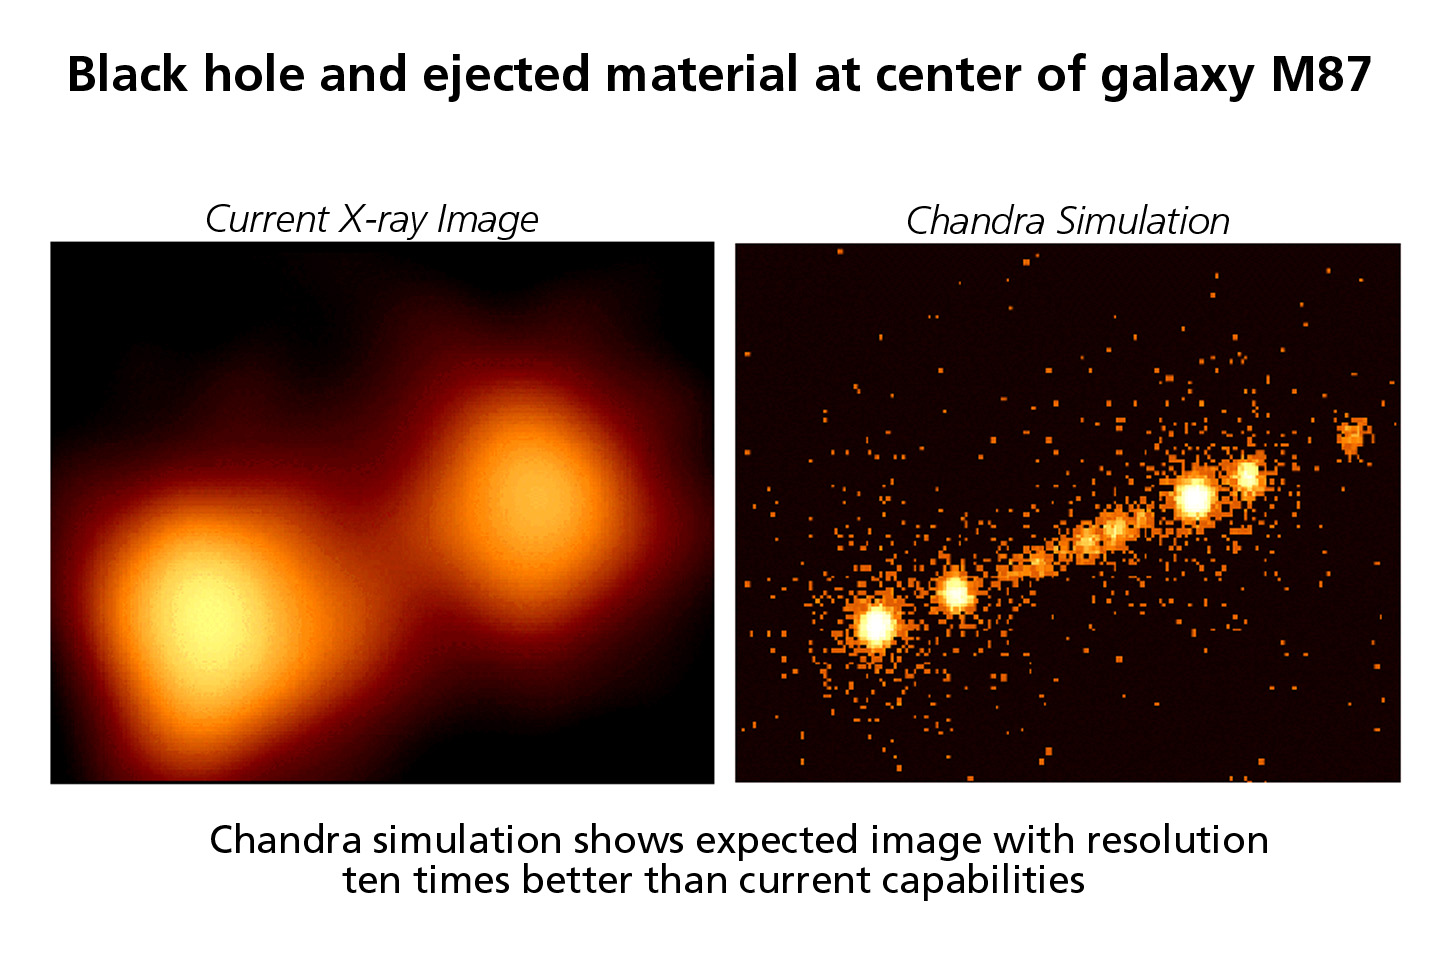
1. M87 Nucleus and Jet, ROSAT Image vs. CXO Simulation
Image covers ~5". ROSAT image on left. CXO simulation based on HRMA, HRC, and aspect camera performance on right.
(Simulation: CXC)
Related Photo Album
Image covers ~5". ROSAT image on left. CXO simulation based on HRMA, HRC, and aspect camera performance on right.
(Simulation: CXC)
Related Photo Album
Download:
2. Cataclysmics In Core Of Globular Cluster NGC6397 - ROSAT Image vs. CXO Simulation In 3-D Projection
ROSAT data, left, suggests several sources. AXAF simulation shows how 20x better angular resolution allows sources to be resolved.
(Simulation: CXC)
ROSAT data, left, suggests several sources. AXAF simulation shows how 20x better angular resolution allows sources to be resolved.
(Simulation: CXC)
Download:
3. Cataclysmics In Core Of Globular Cluster NGC6397 - HST Field
Superimposed circles mark ROSAT positions. Smaller circles around proposed CXO positions. CXO positions offset slightly to correspond to proposed optical IDs. Note #'s of candidates (1 or 2) for CXO vs. 10's for ROSAT.
(Simulation: CXC)
Superimposed circles mark ROSAT positions. Smaller circles around proposed CXO positions. CXO positions offset slightly to correspond to proposed optical IDs. Note #'s of candidates (1 or 2) for CXO vs. 10's for ROSAT.
(Simulation: CXC)
Download:
4. Trapezium Star Cluster, ROSAT Observation vs. CXO Simulation
ROSAT observation (left) detects ~70 sources - PMS stars down to brown dwarfs (possibly). ACIS (right) simulation finding and resolving ~8x more sources, shows gain from CXO.
(Simulation: CXC)
Related Photo Album
ROSAT observation (left) detects ~70 sources - PMS stars down to brown dwarfs (possibly). ACIS (right) simulation finding and resolving ~8x more sources, shows gain from CXO.
(Simulation: CXC)
Related Photo Album
Download:
5. Trapezium Star Cluster, K-Band Observation vs. CXO Simulation
K-band observation - left; CXO simulation - right. Most of the stars in the cluster can be detected and identified by CXO- very young stars, will study hundred to 1000. Can see flares in a day's observation, measure temperatures etc.
(Simulation: CXC / HST)
Related Photo Album
K-band observation - left; CXO simulation - right. Most of the stars in the cluster can be detected and identified by CXO- very young stars, will study hundred to 1000. Can see flares in a day's observation, measure temperatures etc.
(Simulation: CXC / HST)
Related Photo Album
Download:
6. CXO LETG Grating Simulation Of UX ARI
See iron lines, oxygen line, and extend to wavelengths > 100 angstroms.
(Simulation: CXC)
See iron lines, oxygen line, and extend to wavelengths > 100 angstroms.
(Simulation: CXC)
Download:
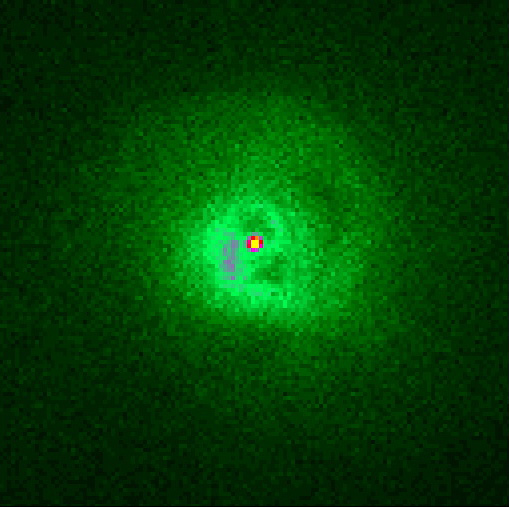
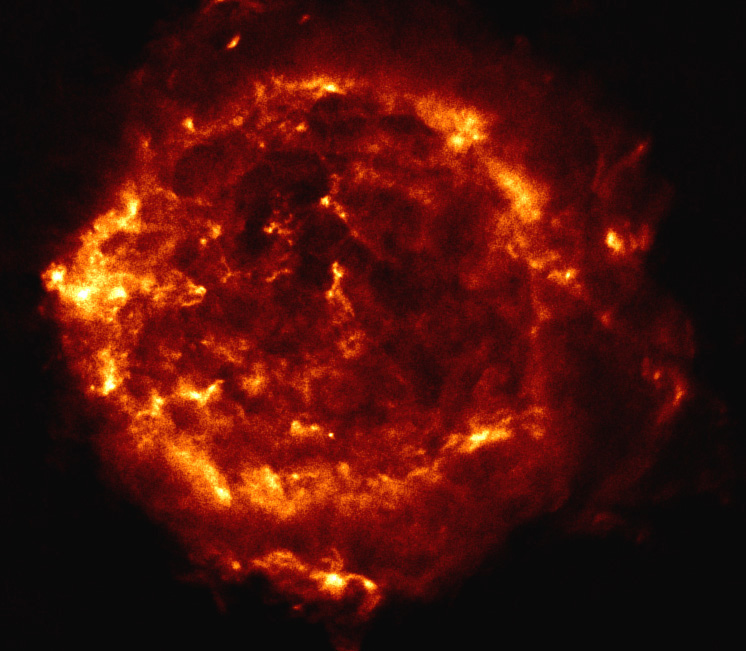
9. ROSAT X-ray Image of the Galaxy NGC 1275
(Illustration: Bohringer et al, 1993, M.N.R.A.S. 264, L25)
Related Photo Album
(Illustration: Bohringer et al, 1993, M.N.R.A.S. 264, L25)
Related Photo Album
Download:
10. Breakup of Cooling Flow
Simulated CXO image showing hypothetical breakup of cooling flow into proto-globular clouds.
(Illustration: Bohringer et al, 1993, M.N.R.A.S. 264, L25)
Related Photo Album
Simulated CXO image showing hypothetical breakup of cooling flow into proto-globular clouds.
(Illustration: Bohringer et al, 1993, M.N.R.A.S. 264, L25)
Related Photo Album
Download:
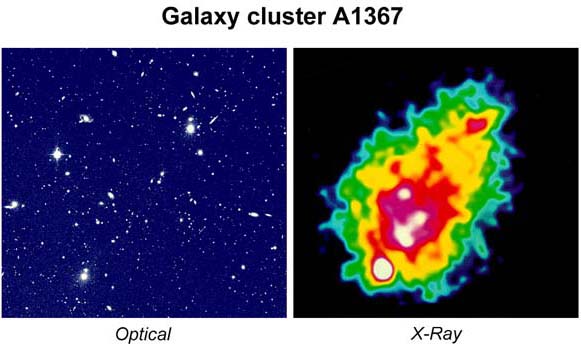
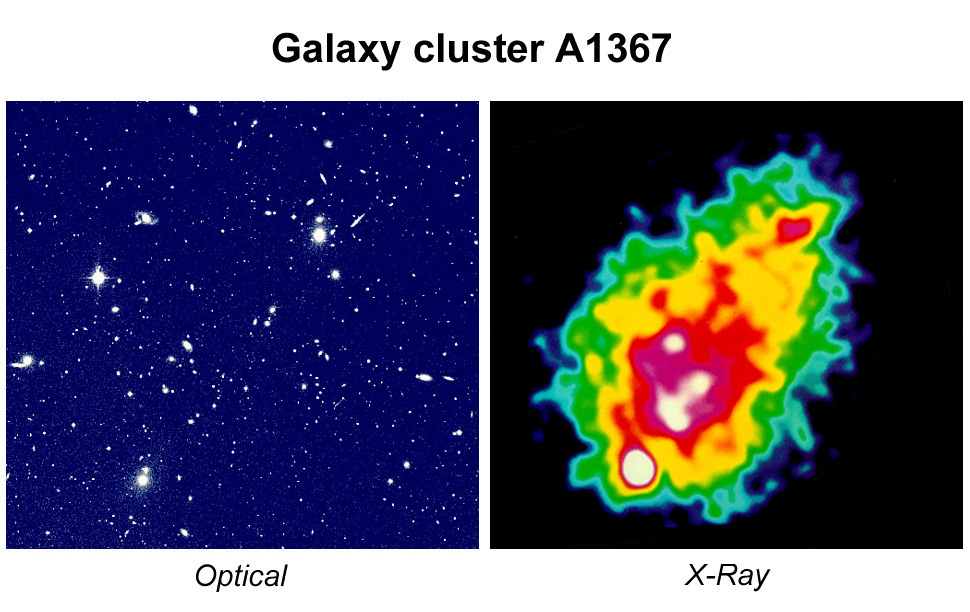
11. Galaxy Cluster A1367 Optical Vs. X-Ray Picture
Optical image is a ground-based picture showing fuzzy, extended galaxies in cluster as well as foreground stars. X-ray image from HEAO-2/Einstein showing patchy, diffuse emission from 10/7th-10/8th degrees K gas filling the space between the galaxies.
(Illustration: CXC)
Optical image is a ground-based picture showing fuzzy, extended galaxies in cluster as well as foreground stars. X-ray image from HEAO-2/Einstein showing patchy, diffuse emission from 10/7th-10/8th degrees K gas filling the space between the galaxies.
(Illustration: CXC)
Download:
Revised: August 06, 2008