


CXC Home | Search | Help | Image Use Policy | Latest Images | Privacy | Accessibility | Glossary | Q&A
1
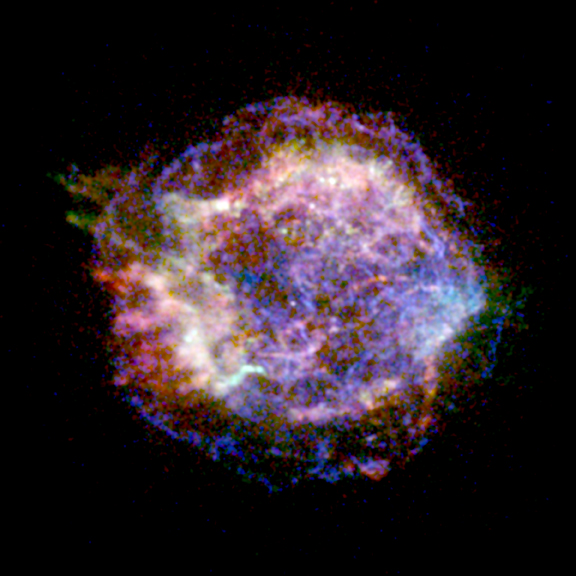
Cassiopeia A, Chandra 3-color X-ray
This 3-color version of the Chandra First Light data displays a wealth of detail and drama. Note the shock wave on the outer edge, and the blow-out on the upper left, as well as the enigmatic bright spot in the middle. The low, medium, and higher X-ray energies of the Chandra data are shown as red, green, and blue.
Credit: NASA/CXC/SAO (courtesy, C.Jones)
2
Cassiopeia A, Chandra X-ray
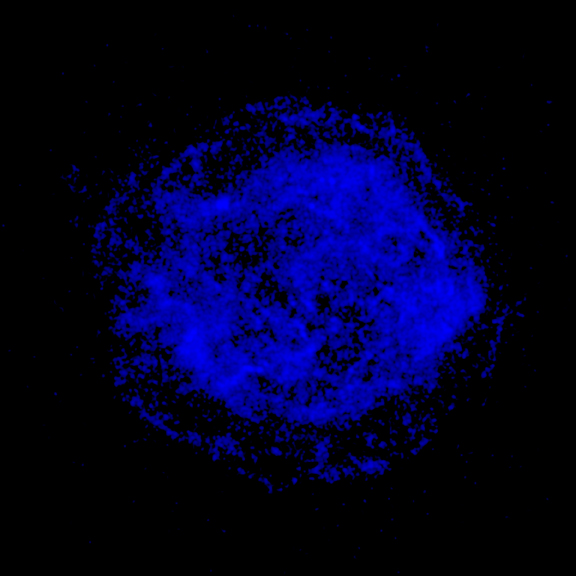
Cas A on Blue: This striking color rendition displays a wealth of detail and drama. Note the shock wave on the outer edge, and the blow-out on the upper left, as well as the enigmatic bright spot in the middle. The colors represent X-ray brightness (yellow = brightest, blue = background), not temperature.
Credit: NASA/CXC/SAO (courtesy, C.Jones)
3
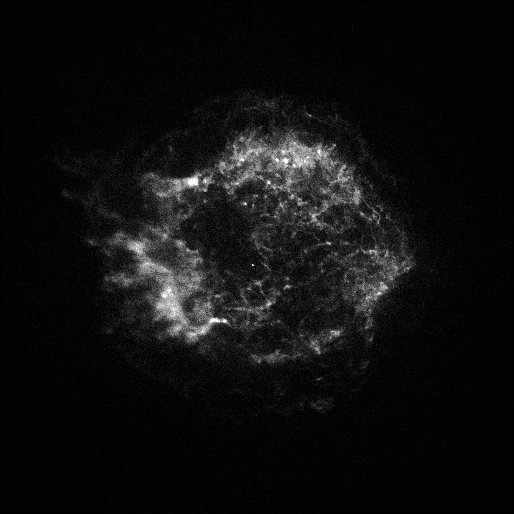
Cassiopeia A, Chandra X-ray
Black and white version of the X-ray image taken of Supernova Remnant Cassiopeia A by the Chandra X-ray Observatory where the brighter colors respresent the more intense X-ray emission.
Credit: NASA/CXC/SAO
Black and white version of the X-ray image taken of Supernova Remnant Cassiopeia A by the Chandra X-ray Observatory where the brighter colors respresent the more intense X-ray emission.
Credit: NASA/CXC/SAO
4
Cassiopeia A, Chandra X-ray
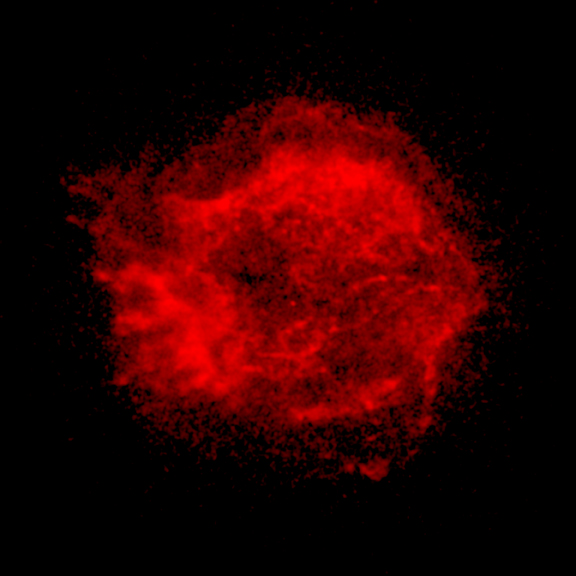
This image from the Chandra X-ray Observatory illustrates the two-dimensional spectral capability of the Advanced CCD Imaging Spectrometer (ACIS) instrument. The image shows the supernova remnant Cas A, where the colors reflect the temperature of the hot gas. Red colors correspond to temperatures below approximately 20 million degrees Celsius, and blue colors correspond to temperatures above approximately 30 million degrees Celsius.
Credit: NASA/CXC/SAO (courtesy, Gordon Garmire, Penn State U & the ACIS Team)
Return to Cassiopeia A (26 Aug 99)
Revised: May 17, 2022