
CXC Home | Search | Help | Image Use Policy | Latest Images | Privacy | Accessibility | Glossary | Q&A
1
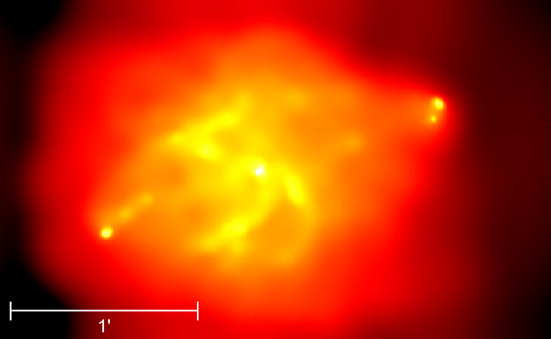
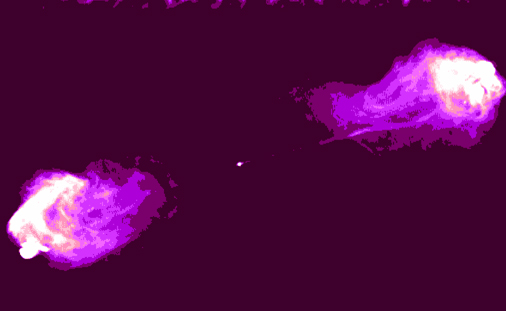
Chandra X-ray Image with Scale
Bar
Scale bar = 1 arcmin
(Credit: NASA/UMD/A. Wilson et al.)
Scale bar = 1 arcmin
(Credit: NASA/UMD/A. Wilson et al.)
2
Grey scale Chandra
X-ray
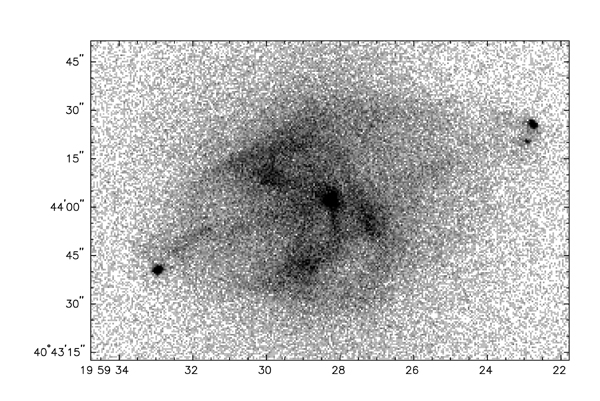
This Chandra X-ray image shows the galaxy Cygnus A, represented in grey scale. The shading is proportional to the square root of the X-ray intensity.
(Credit: NASA/UMD/A. Wilson et al.)
This Chandra X-ray image shows the galaxy Cygnus A, represented in grey scale. The shading is proportional to the square root of the X-ray intensity.
(Credit: NASA/UMD/A. Wilson et al.)
3
X-ray contours of Cygnus
A
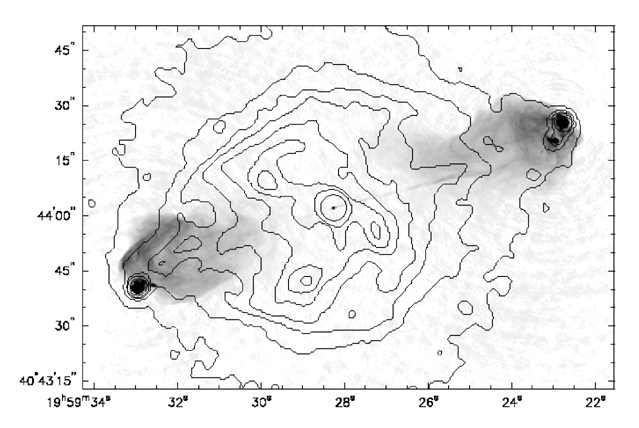
In this image, the X-ray emission (contours) have been superposed on a 6-cm Very Large Array radio map, shown here in grey scale.
(Credit: NASA/UMD/A. Wilson et al)
In this image, the X-ray emission (contours) have been superposed on a 6-cm Very Large Array radio map, shown here in grey scale.
(Credit: NASA/UMD/A. Wilson et al)
4
Illustration of Cygnus
A
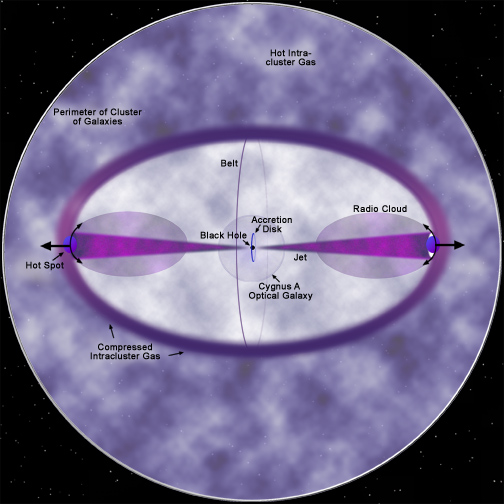
This illustration outlines the physical processes that created the image of Cygnus A observed by the Chandra X-ray Observatory.
(Credit: NASA/CXC/K.Kowal)
This illustration outlines the physical processes that created the image of Cygnus A observed by the Chandra X-ray Observatory.
(Credit: NASA/CXC/K.Kowal)
5
Radio image of Cygnus A
This Very Large Array image of Cygnus A is characterized by very faint, narrow jets, distinct lobes, and hot spots at the ends of the jets. More at APOD
(Credit: NRAO/AUI)
This Very Large Array image of Cygnus A is characterized by very faint, narrow jets, distinct lobes, and hot spots at the ends of the jets. More at APOD
(Credit: NRAO/AUI)
Return to Cygnus A (06 Nov 00)
Revised: May 17, 2022